
Can blogging support Open Education advocacy?
Yes, is the short answer – if you’re blogging evidence-based research outputs in digestible short form. This post unpacks the implications of the visitor stats to my project website, since I began weekly research comms on the different research outcome angles of the Open Textbook as Social Justice research project. This has been a major national scoping study of the potential of open textbooks to support student learning in Australian Higher Education, with a focus on under-represented students.
What did I blog about?
From mid-June I began a dissemination campaign for the Open Textbook as Social Justice research project. I focussed on weekly blog posting to give insight into the different data sets and different findings from the perspective of staff, students and those in different teaching disciplines. I tweeted a few short updates direct to Twitter to let people know that I was soon to begin regular more detailed blog updates. Then I began weekly blog posting from 27th June. I tweeted and emailed all subscribers weekly when each post was published on the website (our email distribution list is at about 220 people.) I also revised the static pages on the website (research team and plan, references and resources etc) so they were up to date.
The aim was to build awareness and momentum ahead of the official release of the final report. We are still waiting for the funder to release the report as I write this blog post. So the website is now a key resource about findings.
What data did I look at?
I wanted to know how well the blog posting was going. I gained access to the Google Analytics dashboard for the website on 17/8/21.
I first looked at the visitors and access patterns during the intensive weekly posting phase (14th June – 16th August 2021). Next, I compared this with the visitors and access from 1st January to 13th June 2021 where I only made a single blog post – a research findings update in February.
Summary of data insights
I thought that the website would probably have no viewers when I wasn’t posting. But that was not the case. The website was a useful resource in both periods of time.
Even when not posting regularly, there were visitors coming to the site from a mix of local of overseas locations, looking at the static website information such as research team, community of open textbook practitioners, research plan and references.
The intensive weekly posts had a much larger and also a quite different type and pattern of readership. Readers were from a local emerging community of practice – and they were not skimming but reading the whole blog post and also explored links – reading time (time on page averages) varied from 4 – 6 minutes and sometimes even over 8 minutes. Posts with snappy research summaries and those that interviewed academics about their practice were very popular. Guest posts from other organisations boosted readership and Twitter followers. Listing events on a local educational-technology OER focussed newsletter has also I think helped gained wider readership.
Impact and implications
When combined with email and personal feedback, I feel that the blogging (website) has been effective to inform and build interest within a growing local community of practice made up of people from library, equity and educational technology professionals. I have heard from local open education advocates that they use the blog content to assist them in their advocacy roles with a range of different stakeholders. The short nuggets, targeted posts to particular audiences combined with evidence based seems to be a useful combination.
If you have a major open education project with a research and/or practice component that is likely to create insights useful for others – consider setting up a project blog site from the start with a google search friendly URL and name. Even if you begin with static pages of intentions and resources, and only blogging progress each few months you are likely to build an audience. When you have more insights to share, if you begin targeted blogging each week or fortnight – you are likely to produce the kinds of materials that will help advocates do a better job. It’s certainly very rewarding!
The details: blog data: 14t June – 16th august 2021
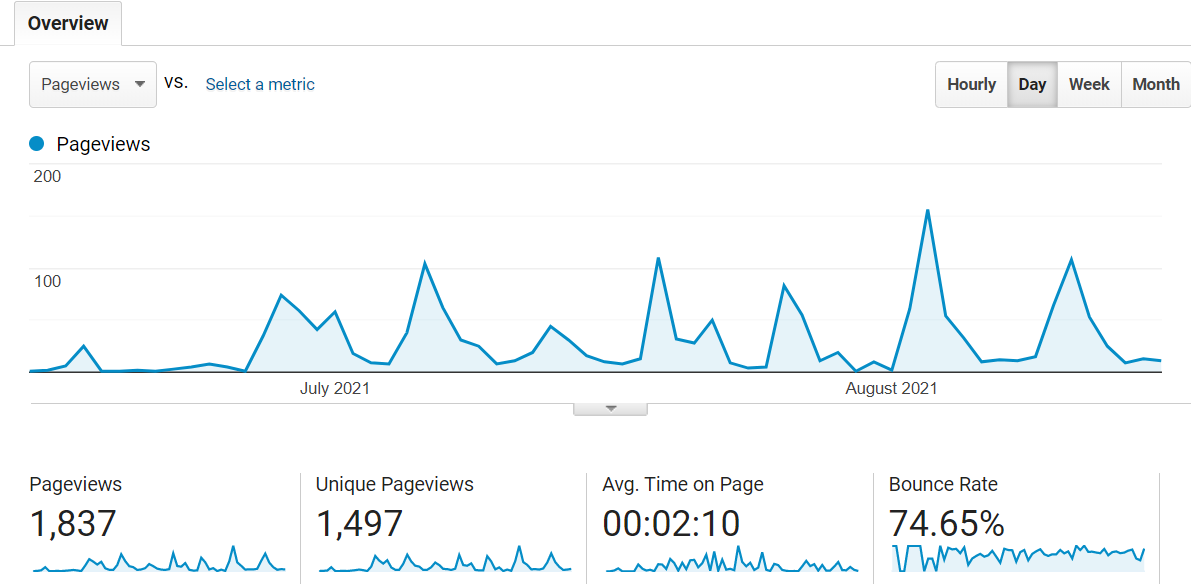
- 1837 pageviews in this 2-month period when posting weekly
- 200-300 visitors per week, most on day after posting (Tuesday): since I began posting weekly updates on 27th June (starting with the student voices/data post) on a Monday each week, there have been around 200-300 visitors per week, with between 80-100 visiting on the Tuesday ie the day after each new post and view numbers tapering off over the rest of the days of the week.
- Lowest to highest daily Pageviews: lowest in the week of Tuesday 13th July with 44 views compared to a high of 156 pageviews on Tuesday 3rd August.
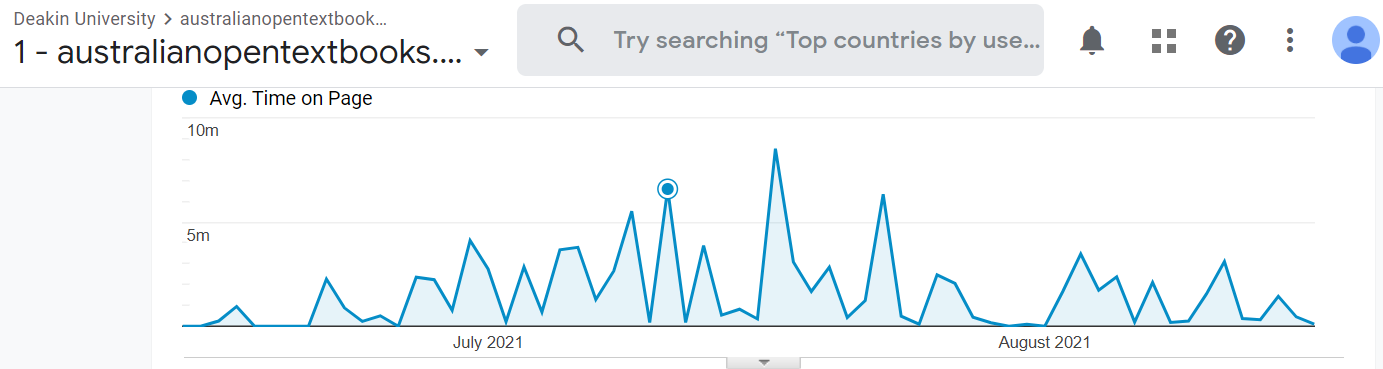
- Long read times, typically 4-6minutes reading blog posts: the time on page report shows that blog visitors are reading the whole post, often spending between 4 and 6 minutes on the page. Readers spent significantly longer reading the blog posts on Friday and weekends, with Tuesdays the next most common day of the week for longer read times. Saturday July 17 had the highest reading time score, the average time spent on the page was 8 minutes and 21 seconds.
- Top 5 blog posts over the 2 months of weekly postings:
- 287 views most within a fortnight – Students talk textbooks: shockingly expensive, restrictive digital access, lacking diversity
- 163 views most within a fortnight – Yarning about USQ’s ‘College Success’ adaptation
- 148 views most within a fortnight – Staff talk: diversified and updated textbooks and reading lists
- 125 views most within a fortnight – Dr Julian Lee: from questioning current textbook practice to writing your own
- 95 views over a month – Dr Ben Whitburn: the process of adopting an updated and more accessible open textbook
- Emails, Twitter and user searching brings traffic
- 53.6% of views come from direct clicks i.e., from my weekly personal emails to subscribers
- 25.6% come from social media (I only use Twitter)
- 17.9% arrive at the blog from web searching
- A small number 2.9% come from other related website such as USCs OER Libguide.
- Australians mostly read the blog: 629 or 82.4% of readers are Australian with only 68 USA readers and 15 Canadian readers, with very small numbers of readers (3-7) from Malaysia, New Zealand, UK, Germany, South Africa, Ireland, India
- Compare this data with visitors from 1st Jan until 13th June (when I only posted once in February, a project outcomes and findings general summary): 327 visitors and 999 pageviews, fairly evenly distributed at 4-10 each day from Jan to May and a slight peak in June when I probably Tweeted out a project update with link to blog. Visitors explore the static website page info (about, project team, community etc) and the single Feb blog post. Users are still mostly Australian (64%) but also 7% from both the UK and USA with a different variety of minority readers’ countries including Finland, China, Netherlands, Malaysia, Hong-Kong, UAE. As expected, with no emails being sent or events occurring, 42% of visits came through google/web searching. 45% still came through direct links to the blog.
Sarah Lambert
Cover imagine licensed CC0
Sarah Lambert
PhD thesis "Open Education as Social Justice" (2019). Interested in interdisciplinary theory, methods, mentoring, systematic reviews. Widening HE participation practitioner.

You May Also Like

Proyecto de diversidad, equidad e inclusión en América Latina: actualización y resultados finales

GO-GN to chair OER22!